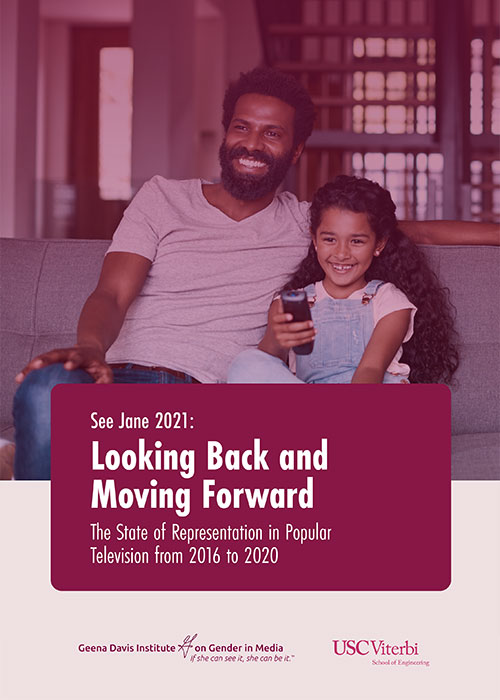
Pioneering Inclusion in Media: A Five-Year Analysis
Since its inception in 2004, the Geena Davis Institute has been at the forefront of promoting equity, inclusion, and diversity in family media and entertainment. Renowned for its groundbreaking research and advocacy, it stands as the pioneering organization to analyze representation across six critical identities: gender, race/ethnicity, LGBTQIA+, disability, age (50+), and body type. This report delves into the presence of these identities within the most watched broadcast and cable scripted TV shows over the last five years.
Significant Strides and Current Challenges
Our findings, as detailed in our 2019 See Jane Report, indicate a significant increase in female leads and co-leads in children’s television, rising from 42.0% in 2008 to 52.0% in 2018. Despite this progress, a slight dip to 45.0% in 2019 underscores the ongoing need for vigilance in casting diverse leading roles. This 2021 See Jane Report expands our scope beyond children’s shows to assess diversity in television programming for all ages, identifying trends and areas needing attention to enhance representation across all demographics.
Impact of COVID-19 on Media Production and Diversity
The COVID-19 pandemic has undeniably affected media production, as evidenced by a drop in the number of original scripted TV programs—from a high of 532 in 2019 to 493 in 2020. This disruption has likely influenced both the production and representation in popular TV programming, highlighting the need for resilient strategies to maintain diversity during challenging times.
Inclusive Representation: Today’s Reality and Tomorrow’s Goal
Despite efforts to diversify storytelling, our analysis reveals that popular TV and cable programming continues to be predominantly led by white male characters. The report further explores the representation of various demographics, noting:
- Women in Minor Roles: Women and girls constituted 37.8% of minor characters in 2016, increasing impressively to 52.7% by 2020.
- Racial and Ethnic Diversity: The proportion of BIPOC supporting characters increased from 32.2% in 2016 to 40.4% in 2020.
- Disability and Age Representation: There has been a notable rise in disabled lead/co-lead characters, from virtually none in 2016 to 19.4% in 2020. However, characters aged 50+ remain underrepresented, making up less than a quarter of lead roles.
- LGBTQIA+ and Body Diversity: The absence of LGBTQIA+ leads or co-leads and minimal representation of large body types persist as significant gaps.
The Path Forward
To foster a global culture that reflects the diversity of its audience, it is imperative that media representation evolves to include all societal segments. This report not only sheds light on current discrepancies but also serves as a call to action for the industry to embrace and reflect the true diversity of our global community.

